Graph Visualisation
Foam comes with a graph visualisation of your notes. To see the graph execute the Foam: Show Graph command.
The graph will:
- allow you to highlight a node by hovering on it, to quickly see how it's connected to the rest of your notes
- allow you to select one or more (by keeping
SHIFTpressed while selecting) nodes by clicking on them, to better understand the structure of your notes - allow you to navigate to a note by clicking on it while pressing
CTRLorCMD - automatically center the graph on the currently edited note, to immediately see it's connections
Custom Graph Styles
Currently, custom graph styles are supported through the foam.graph.style setting.
A sample configuration object is provided below:
"foam.graph.style": {
"background": "#202020",
"fontSize": 12,
"lineColor": "#277da1",
"lineWidth": 0.2,
"particleWidth": 1.0,
"highlightedForeground": "#f9c74f",
"node": {
"note": "#277da1",
"placeholder": "#545454",
}
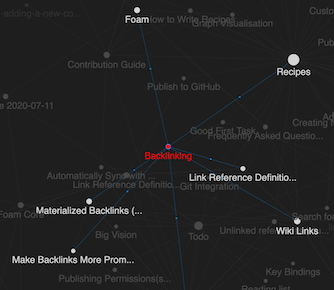
}Style nodes by type
It is possible to customize the style of a node based on the type property in the YAML frontmatter of the corresponding document.
For example the following backlinking.md note:
---
type: feature
---
# Backlinking

...
And the following settings.json:
"foam.graph.style": {
    "node": {
        "feature": "red",
    }
}
Will result in the following graph:
Backlinks
Foam
4. Get an overview of your **Foam** workspace using a [[graph-visualisation]] (⚠️ WIP), and discover relationships between your thoughts with the use of [[backlinking]].
Recipes
- Explore your notes using [[graph-visualisation]]
Creating New Notes
- You shouldn't worry too much about categorizing your notes. You can always [[search-for-notes]], and explore them using the [[graph-visualisation]].